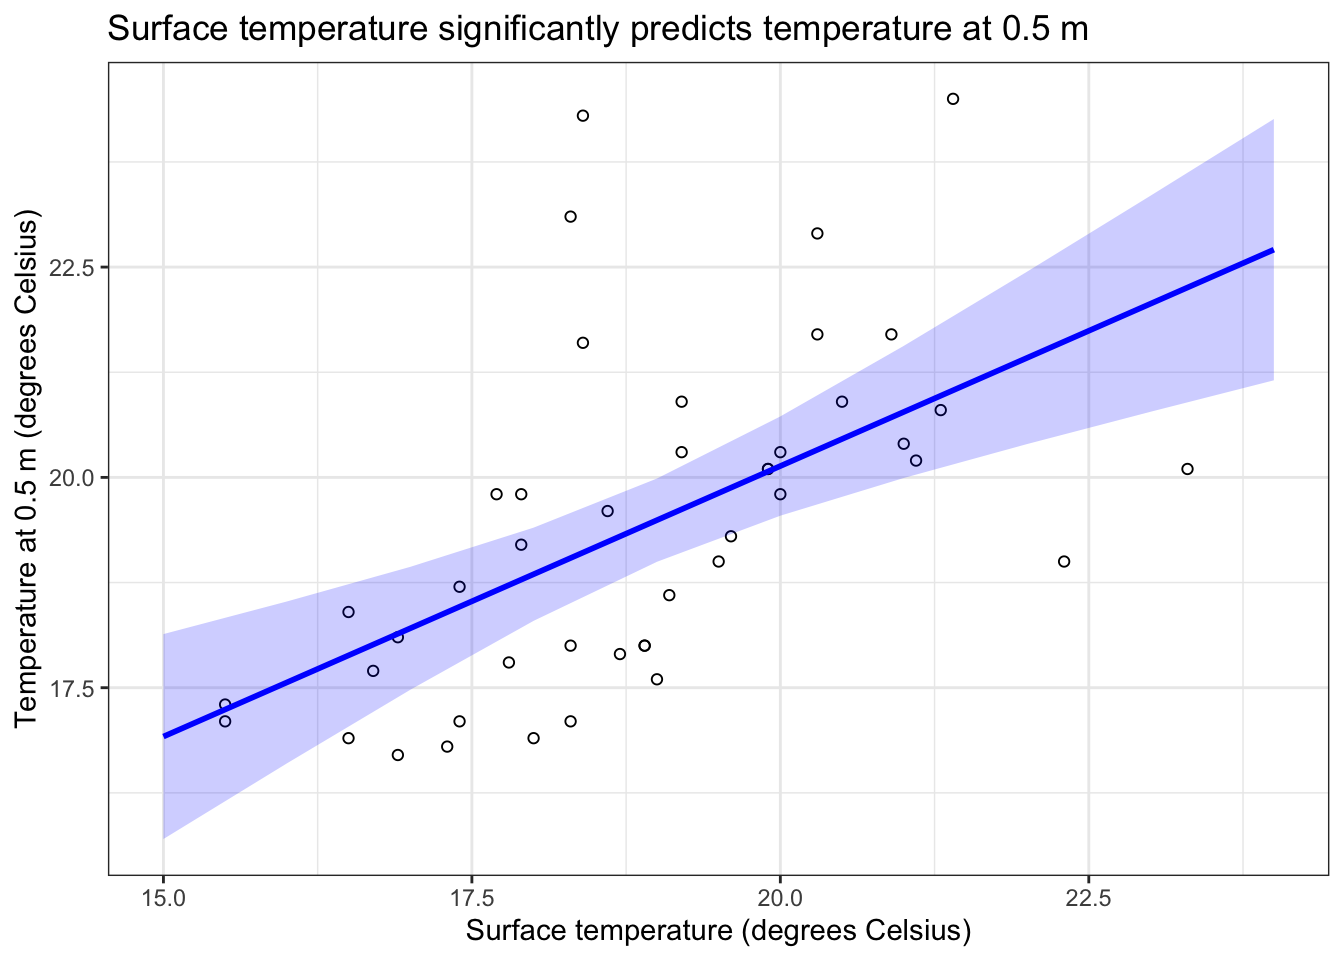
An example scatter plot with model predictions and confidence interval ribbon.
Description
This was a workshop on using R for data cleaning, wrangling, preliminary analysis, and visualization all based on mostly {tidyverse} with some bonus model predictions from {ggeffects}. I designed it for the California Ecology and Conservation course in Fall 2023, which I was lucky enough to support as a TA.